

analyse data intuitively
All your information at your fingertips. Real-time and historic. Making cross sections at will. Exploring trends and black spots. Gaining a proper understanding of what is happening in your nature conservation area, where, when, how often, who are involved, etc. And most important: translating this into actionable insights.
That’s the promise and ambition of the Focus Data Explorer: browse through all your data sources, as if they are one, and find patterns among incidents, poached species, kind of snares being used, and other relevant issues.
Focus helps you to achieve this by automatically transforming your data into meaningful concepts and enabling you to simply select and visualise them on maps, timelines and graphs.

In one or two clicks I have a summary of what I want in relation to any incident.
That is really awesome!
Moses L., Lead Analyst, Kenya
how focus works
focus TRANSForms DATA INTO CONCEPTS
In most systems, data can only be found and calculated with, if you use the right spelling (syntax). Hence, if you want to count all antilopes for example, you’ve got two options to get your results. Your first option is to make a query that includes all members of the antilopes family (kudu, gazelle, impala, etc.). The second option is to add a field to your database in which you specify the group of species to which the recorded species belongs. Both options are laborious and prone to errors.
In Focus (and all other tools in our tool suite) we use a semantic approach. Semantics is a technology that allows syntactical data to be transformed into concepts with meaning. Sounds difficult, but in practice it is very very easy! Take the antilope for example. As humans we all know that the spelling of antelope, antilop, and antilopes is different, but that these words probably all mean the same. In the semantic data world, synonyms, misspellings, plural forms, and different languages, all relate to the antilope concept. And if you use any of these to search for antilopes, you’ll find all.
But there is more. Semantical knowledge models also allow to find “child-concepts” of any parent. Thus, if you search for antilopes, you’’ll find all subspecies (kudu, gazelle, etc.) as well.
The result
More intuitive and meaningful search and complete search results
More powerful and easier analytics, and
Automated similarity suggestions. Example: the modus operandi of this incident looks very much like the one used in these, and these incidents.
how to use this for your nature conservation and wildlife protection purposes?
The major concepts included in Focus are especially being designed and categorised for nature conservation and wildlife protection purposes. They include:
Findings, including offences, recoveries, and signs such as footprints, tire-prints, gunshots, etc.
Natural resources, including many species of fauna and flora
Typical ranger responses, such as removing snares or following tracks.
Periods (days of the week and months of the year)
Using Focus, you can combine these concepts (filters) with geo-spatial functions (map) and time-spatial functions (time-slider) to make any type of selection.
By default, all available data sources and concepts are included in your analysis. However, by selecting one particular data source or concept, you can restrict your analysis to that particular data source or concept only. Likewise, by excluding one data source or concept, you can analyse all data sources or concepts except the excluded one.
TYPES OF DATA SOURCES THAT CAN BE INCLUDED in focus
Focus can handle all sorts of data, including:
custom databases, spreadsheets, and documents
custom maps and map layers
third party systems adhering to open standards
trackers and tracers
sensor data
photos and
web feeds
Data inside the platform can be exported and shared with third party systems, given they adhere to open standards.
graphs: SEARCHING FOR MEANINGFUL RELATIONS
The idea of graphs is that you can find meaningful relations between observations. For example, because they all share the same type of species, offences, arrestees, vehicles, snares or tools.
In a Focus graph, you can see clusters of incidents and can get specific information related to an incident, like things recovered and photos made at the scene. In the legend (right lower corner) you can select or exclude concepts that are not relevant for your search.

Above you see the relations among incidents recorded in the last month. Two people have been officially warned for charcoal burning, while one person has been arrested for poaching. He was found with the carcass of a dikdik and a panga (large knife).
ENRICH YOUR DATA WITH ONLINE KNOWLEDGE
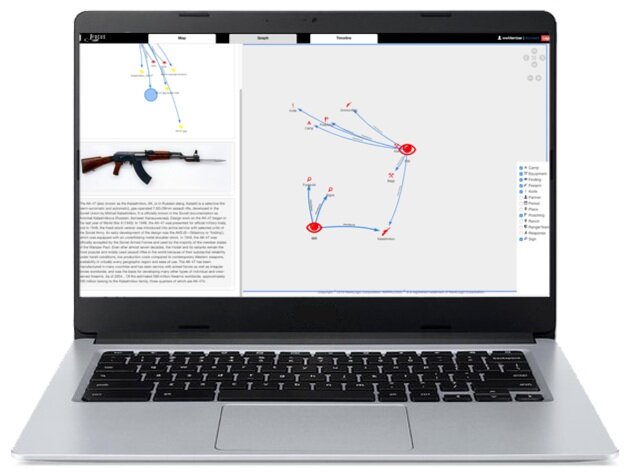
As a world community, we know much more about for example a Kalashnikov or an Eland than one average person. By linking the concepts (see above) of Kalashnikov and Eland to an online resource such as Wikipedia, all characteristics of these concepts become available to the analyst, or commander in charge for that matter (implemented). This is called Linked Open Data.
In Focus all characteristics of the concept are made available for inclusion in your analytical questions. For example, without having any information about it in your own database, you will be able to make a list of all incidents in which endangered species have been involved.
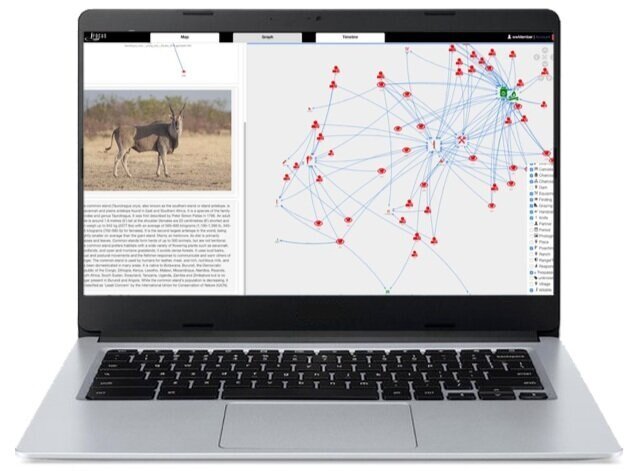
Connecting own data with Linked Open Data, in this case about Eland
Connecting own data with Linked Open Data, in this case about Kalasnikov
HOW WE CREATED THIS OVERVIEW IN JUST 3 CLICKS
use Data Sources to select Tracks (containing all tracker data)
use the time slider to select 1-11-2018 to 30-11-2018
click on Timeline to see all tracks in that period, including their individual length (in km)
Meanwhile, in the Filter section you see the number of tracks recorded per team in November. You can further specify the selection of tracks in the Timeline by selecting any of the teams.
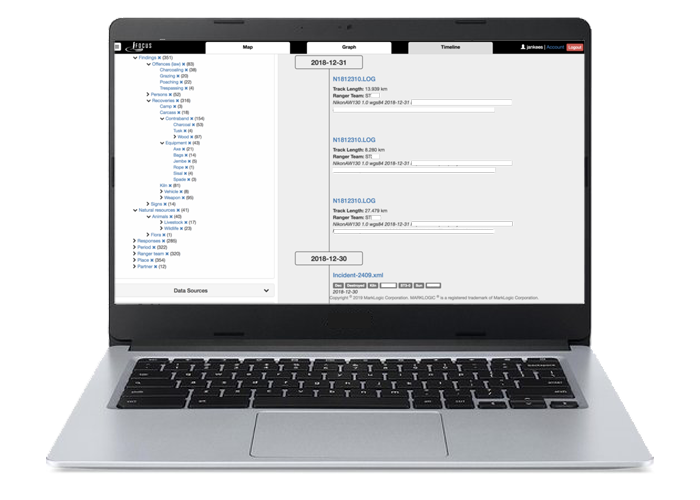
Track length per ranger team per day, ordered on Timeline
Inspired?
Are you inspired by all the capabilities of our Focus Data Explorer? Focus is part of our complete Wildlife tool suite and offers you all the information you need at your fingertips to protect wildlife and nature.
contact an expert
Want to learn more about our Focus Data Explorer? Fill this out and we’ll reach out shortly.